14.4 Diagrams
Issue 9077 - remove misleading phrase about relationship to activity graphs and add explanation at the end
Interaction diagrams come in different variants. The most common variant is the Sequence Diagram
(Sequence
Diagrams on page 525) that focuses on the Message interchange between a number of Lifeline s. Communication
Diagrams
(Communication Diagrams on page 534) show
interactions through an architectural view where the arcs between the communicating Lifeline s are decorated with description
of the passed Messages and their sequencing. Interaction Overview Diagrams
(Interaction Overview Diagrams on page 537) define interactions in
a way that promotes overview of the control flow. In the Annexes one may also find optional diagram notations such as Timing
Diagrams and Interaction Tables. (Overview diagrams have notational elements that are similar to certain elements used in
Activity diagrams (flow lines, forks, joins, etc.). However, although the notation and the general purpose of these elements
is the same in both cases, their detailed semantics are quite different and modelers should not interpret Overview diagrams
as if they were Activity diagrams.)
Sequence Diagrams
The most common kind of Interaction Diagram is the Sequence Diagram, which focuses on the Message interchange between a number
of Lifeline s.
A sequence diagram describes an Interaction by focusing on the sequence of Messages that are exchanged, along with their corresponding
OccurrenceSpecifications on the Lifeline s. The Interactions that are described by Sequence Diagrams are described in this
chapter.
The graphic nodes that can be included in sequence diagrams
are shown in Table 14.1
.
Table 14.1 - Graphic nodes included in sequence diagrams
Table 14.1 - Graphic nodes included in sequence diagrams
Table 14.1 - Graphic nodes included in sequence diagrams
*Graphic Paths
Issue 8352 -add period at end
The graphic paths between the graphic nodes are given
in Table 14.2
.
Table 14.2 - Graphic paths included in sequence diagrams
Node Type |
Notation |
|
Reference |
|
|
|
|
|
|
|
|
| Message |

|
Code doit(z) |
Messages come in different variants depending on what kind of Message they convey. Here we show an asynchronous message, a
call and a reply. These are all complete messages. See Message (from BasicInteractions ) on page 512.
|
|
|
| Lost Message |
|
lost |
Lost messages are messages with known sender, but the reception of the message does not happen. See Message (from BasicInteractions )
on page 512.
|
|
|
| Found Message |
|
found |
Found messages are messages with known receiver, but the sending of the message is not described within the specification.
See Message (from BasicInteractions ) on page 512.
|
|
|
| GeneralOrdering |
|

|
See GeneralOrdering (from BasicInteractions ) on page 501.
|
|
|
*Examples
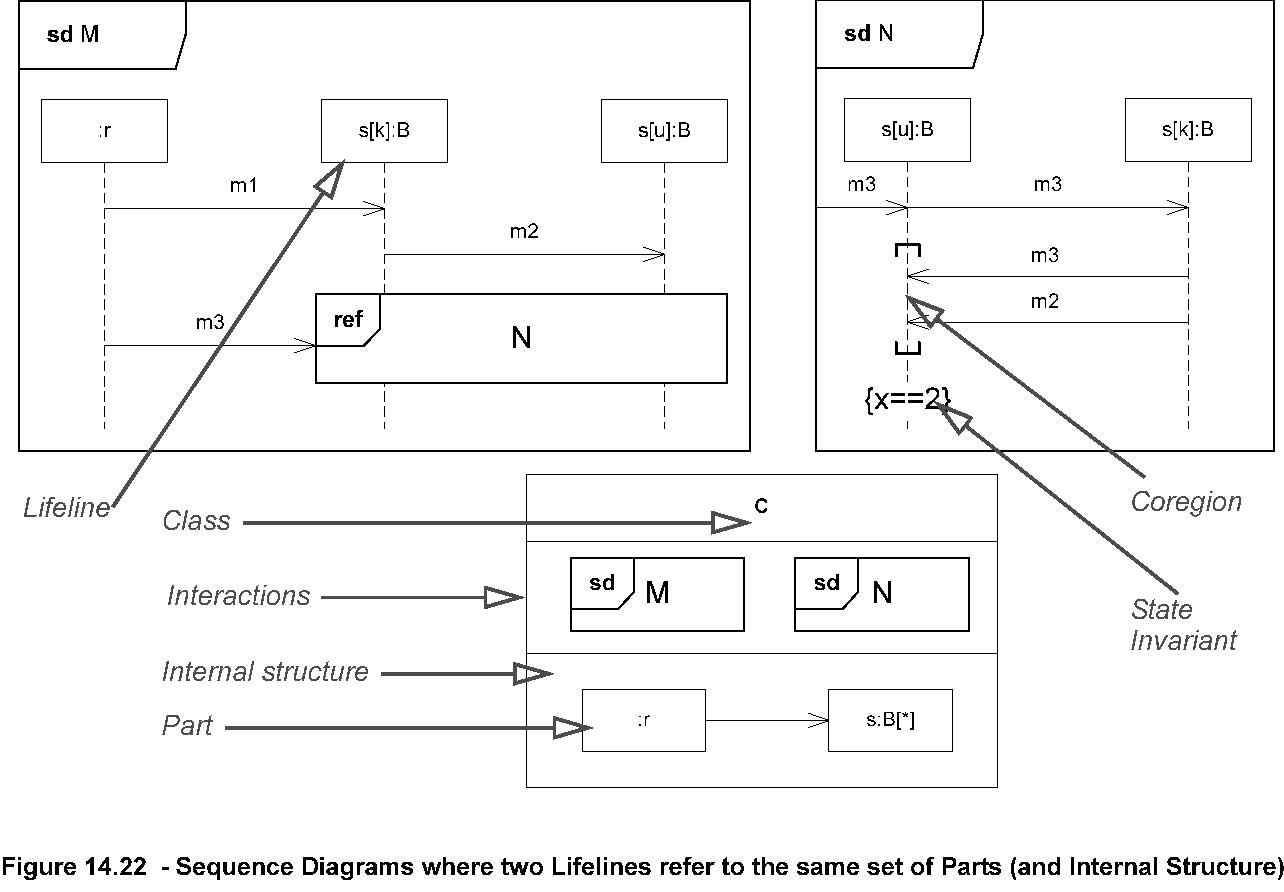 Figure 14.22 - Sequence Diagrams where two Lifeline s refer to the same set of Parts (and Internal Structure)
The sequence diagrams
shown in Figure 14.22 show
a scenario where r sends m1 to s[k] (which is of type B), and s[k] sends m2 to s[u]. In the meantime independent of s[k] and
s[u], r may have sent m3 towards the InteractionUse N through a gate. Following the m3 message into N we see that s[u] then
sends another m3 message to s[k]. s[k] then sends m3 and then m2 towards s[u]. s[u] receives the two latter messages in any
order (coregion). Having received these messages, we state an invariant on a variable x (most certainly owned by s[u] ).
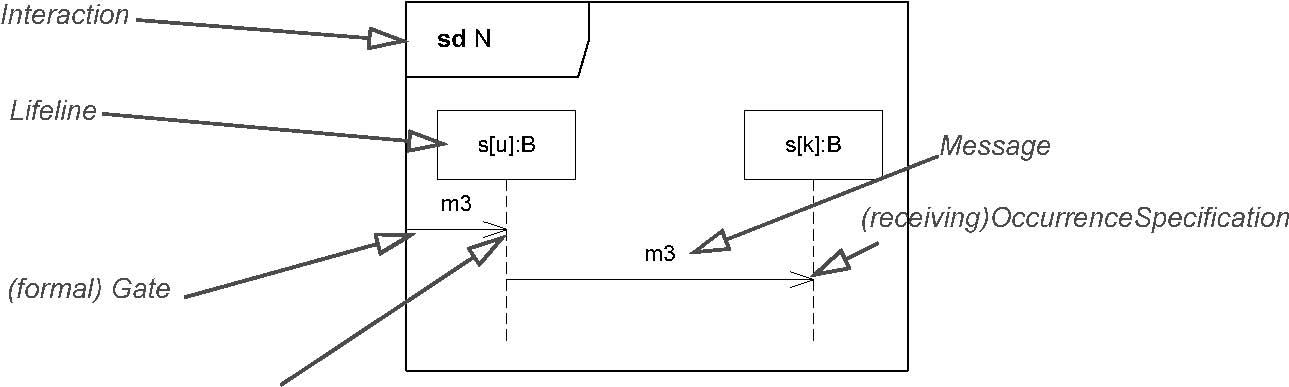
In order to explain the mapping of the notation onto the metamodel we have pointed out areas and their corresponding
metamodel concept in Figure 14.23. Let us go through the simple diagram
and explain how the metamodel is built up. The whole diagram is an Interaction (named N). There is a formal gate (with implicit
name in_m3) and two Lifeline s (named s[u] and s[k] ) that are contained in the Interaction. Furthermore the two Messages (occurrences)
both of the same type m3, implicitly named m3_1 and m3_2 here, are also owned by the Interaction. Finally there are the three
OccurrenceSpecifications.
We have omitted in this metamodel the objects that are more peripheral to the Interaction model, such as the Part s and the
class B and the connector referred by the Message.
Issue 8349 - replace ‘EventOccurrence’ with ‘OccurrenceSpecification’; add underlines in lower figure
OccurrenceSpecification
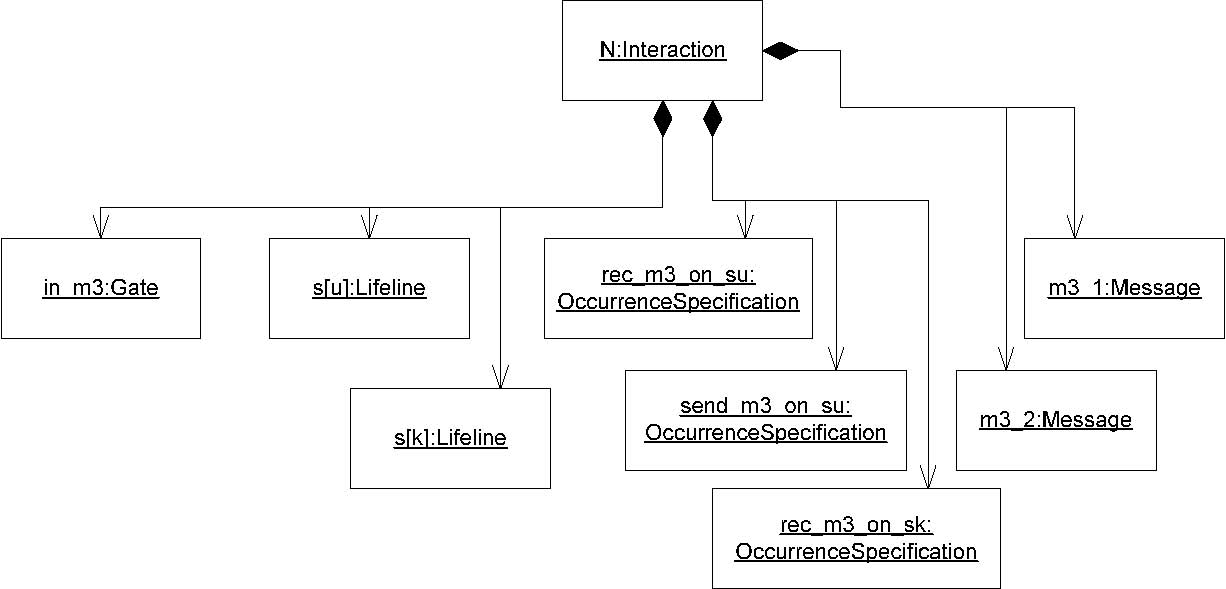
Figure 14.23 - Metamodel elements of a sequence diagrams
Issue 7996 -Annotate figure 14.24.
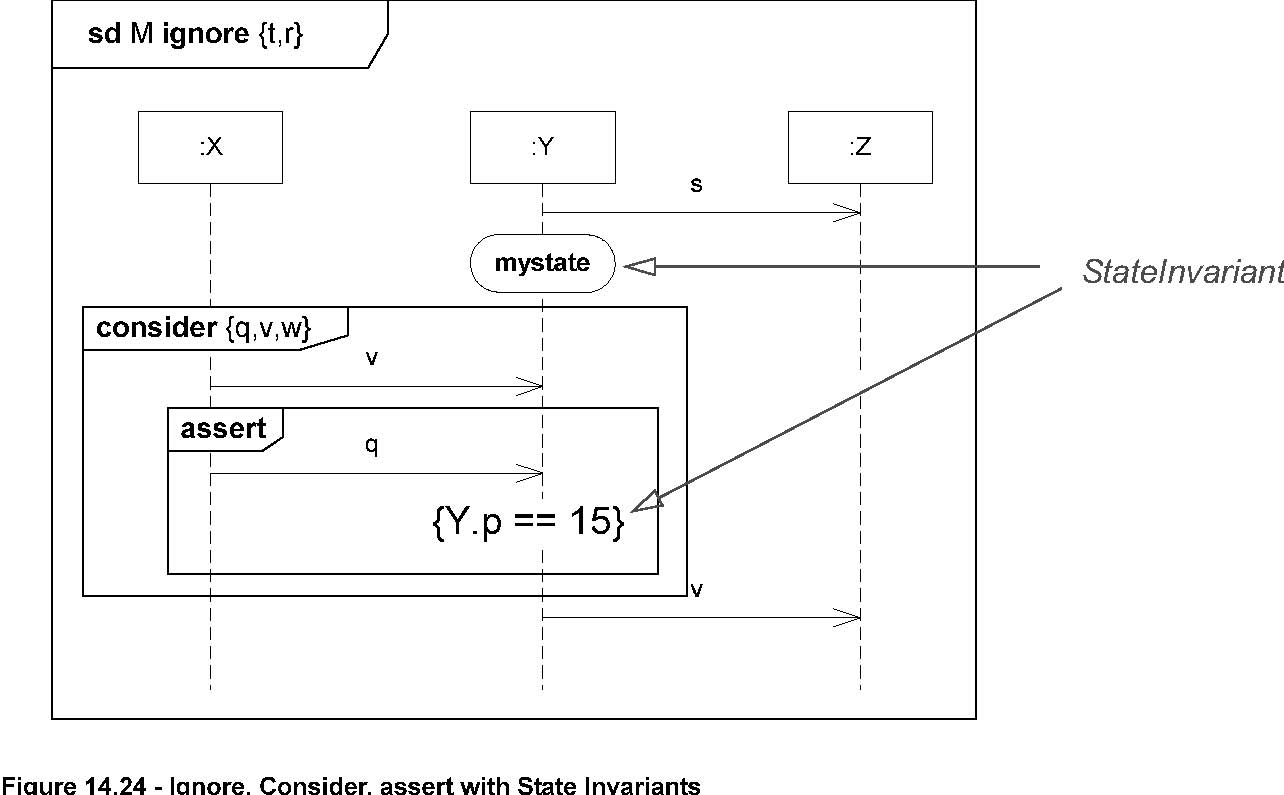 Figure 14.24 - Ignore, Consider, assert with State Invariants
In
Figure 14.24 we have an Interaction M, which
considers message types other than t and r. This means that if this Interaction is used to specify a test of an existing system
and when running that system a t or an r occurs, these messages will be ignored by this specification. t and r will of course
be handled in some manner by the running system, but how they are handled is irrelevant for our Interaction shown here.
The State invariant given as a state mystate will be evaluated at runtime directly prior to whatever event occurs on Y after
mystate. This may be the reception of q as specified within the assert-fragment, or it may be an event that is specified to
be insignificant by the filters.
The assert fragment is nested in a consider fragment to mean that we expect a q message to occur once a v has occurred here.
Any occurrences of messages other than v, w, and q will be ignored in a test situation. Thus the appearance of a w message
after the v is an invalid trace.
The state invariant given in curly brackets will be evaluated prior to the next event occurrence after that on Y.
Internal Structure and corresponding Collaboration Uses
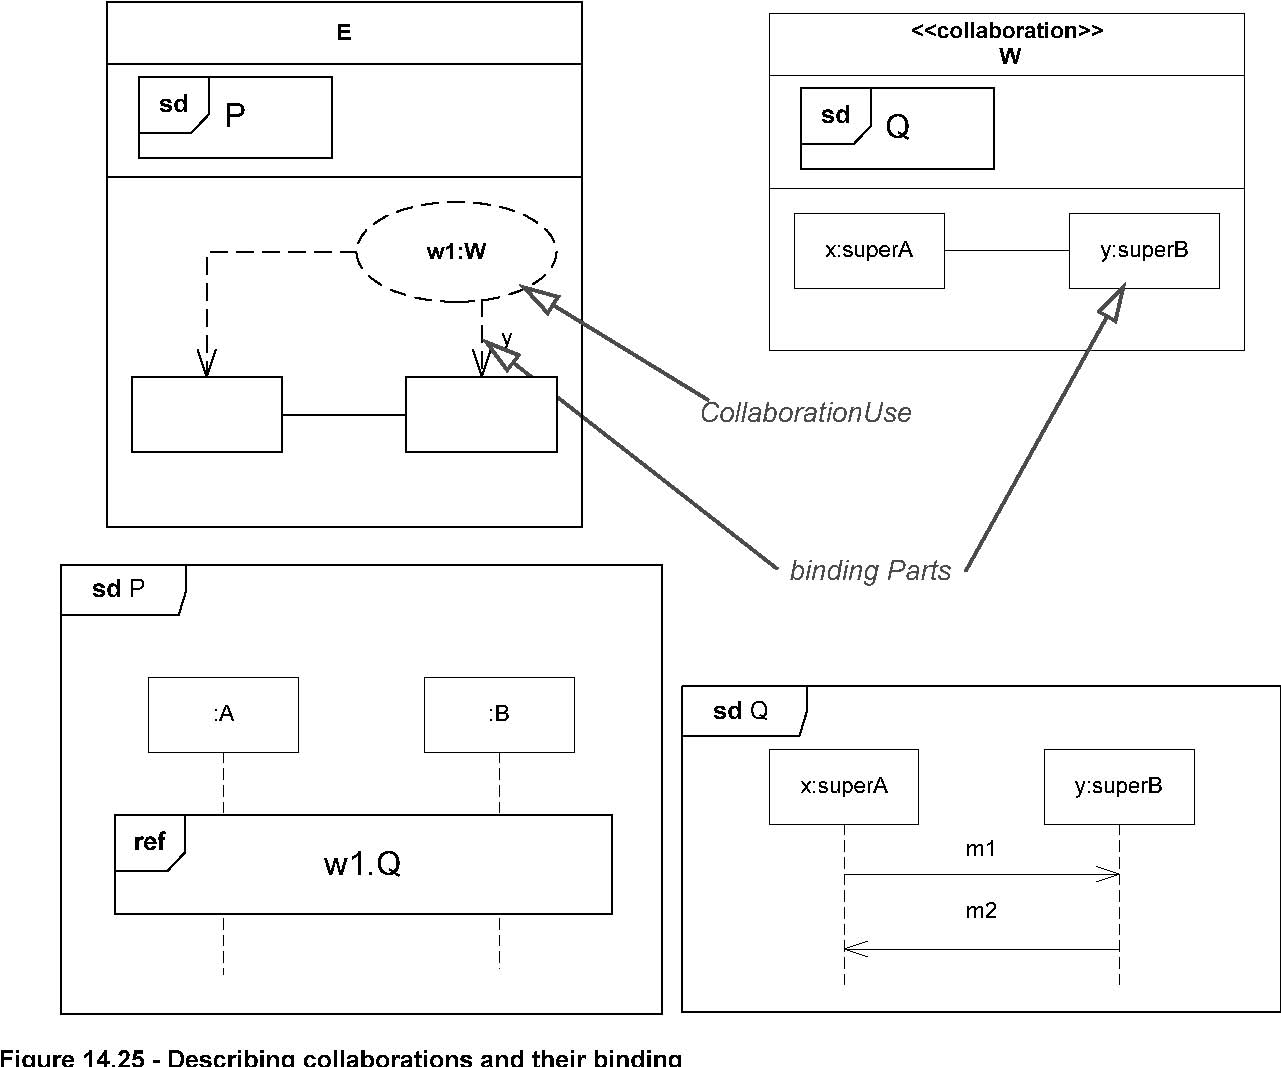 Figure 14.25 - Describing collaborations and their binding
CollaborationUse
binding Parts
The example in Figure 14.25 shows how
collaboration uses are employed to make Interactions of a Collaboration available in another classifier.
The collaboration W has two parts x and y that are of types (classes) superA and superB respectively. Classes A and B are
specializations of superA and superB respectively. The Sequence Diagram Q shows a simple Interaction that we will reuse in
another environment. The class E represents this other environment. There are two anonymous parts :A and :B and the CollaborationUse
w1 of Collaboration W binds x and y to :A and :B respectively. This binding is legal since :A and :B are parts of types that
are specializations of the types of x and y.
In the Sequence Diagram P (owned by class E) we use the Interaction Q made available via the CollaborationUse w1.
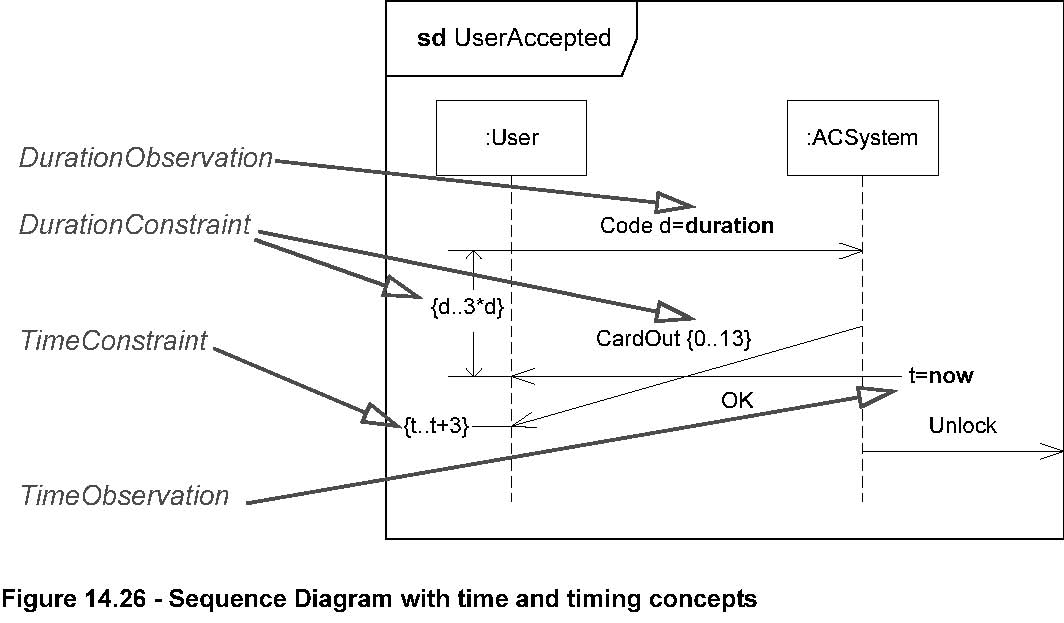 Figure 14.26 - Sequence Diagram with time and timing concepts
The Sequence Diagram in Figure 14.26 shows how time and timing notation may be applied to describe time observation
and timing constraints. The :User sends a message Code and its duration is measured. The :ACSystem will send two messages
back to the :User. CardOut is constrained to last between 0 and 13 time units. Furthermore the interval between the sending
of Code and the reception of OK is constrained to last between d and 3*d where d is the measured duration of the Code signal.
We also notice the observation of the time point t at the sending of OK and how this is used to constrain the time point of
the reception of CardOut.
Communication Diagrams
Communication Diagrams focus on the interaction between Lifeline s where the architecture of the internal structure and how
this corresponds with the message passing is central. The sequencing of Messages is given through a sequence numbering scheme.
Communication Diagrams correspond to simple Sequence Diagrams that use none of the structuring mechanisms such as InteractionUse s
and CombinedFragment s. It is also assumed that message overtaking (i.e., the order of the receptions are different from the
order of sending of a given set of messages) will not take place or is irrelevant.
*Graphical Nodes
Communication diagram nodes are shown
in Table 14.3
.
Table 14.3 - Graphic nodes included in communication diagrams
Node Type |
Notation |
Reference |
|
|
|
|
|
|
|
|
|
| Frame |
sd EventOccurrence |
The notation shows a rectangular frame around the diagram with a name in a compartment in the upper left corner. See Interaction
(from BasicInteraction, Fragments ) on page 501.
|
|
|
|
| Lifeline |
s[k]:B |
See Lifeline (from BasicInteractions , Fragments ) on page 511.
|
|
|
|
*Graphic Paths
Graphic paths of communication diagrams are given
in Table 14.4
.
Table 14.4 - Graphic paths included in communication diagrams
Node Type Notation Reference
Message See
Message (from BasicInteractions ) on page 512 and
Sequence expression on page 536. The arrow shown
1a m1()

here indicates the communication direction.
*Examples
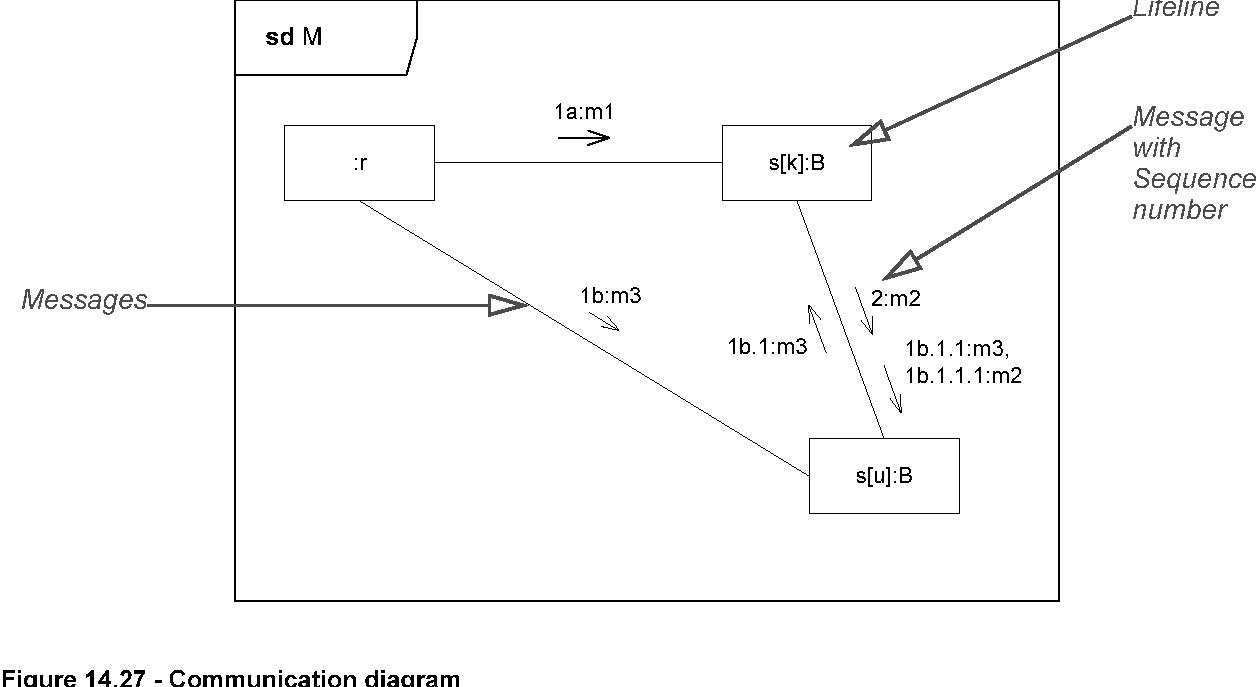 Figure 14.27 - Communication diagram
The Interaction described by a Communication Diagram
in Figure 14.27 shows messages m1 and m3 being sent
concurrently from :r towards two instances of the part s. The sequence numbers show how the other messages are sequenced.
1b.1 follows after 1b and 1b.1.1 thereafter etc. 2 follows after 1a and 1b.
*Sequence expression
The sequence-expression is a dot-separated list of sequence-terms followed by a colon (‘:’).
sequence-term ‘.’ . . . ‘:’
Each term represents a level of procedural nesting within the overall interaction. If all the control is concurrent, then
nesting does not occur. Each sequence-term has the following syntax:
[ integer | name ] [ recurrence ]
The integer represents the sequential order of the Message within the next higher level of procedural calling. Messages that
differ in one integer term are sequentially related at that level of nesting. Example: Message 3.1.4 follows Message
3.1.3 within activation 3.1. The name represents a concurrent thread of control. Messages that differ in the final name are
concurrent at that level of nesting. Example: Message 3.1a and Message 3.1b are concurrent within activation 3.1. All threads
of control are equal within the nesting depth.
The recurrence represents conditional or iterative execution. This represents zero or more Messages that are executed depending
on the conditions involved. The choices are:
‘*’ ‘[’ iteration-clause ‘]’an iteration‘[’ guard ‘]’a branch
An iteration represents a sequence of Messages at the given nesting depth. The iteration clause may be omitted (in which case
the iteration conditions are unspecified). The iteration-clause is meant to be expressed in pseudocode or an actual programming
language, UML does not prescribe its format. An example would be: *[i := 1..n].
A guard represents a Message whose execution is contingent on the truth of the condition clause. The guard is meant to be
expressed in pseudocode or an actual programming language; UML does not prescribe its format. An example would be: [x > y].
Note that a branch is notated the same as an iteration without a star. One might think of it as an iteration restricted to
a single occurrence.
The iteration notation assumes that the Messages in the iteration will be executed sequentially. There is also the possibility
of executing them concurrently. The notation for this is to follow the star by a double vertical line (for parallelism): *||.
Note that in a nested control structure, the recurrence is not repeated at inner levels. Each level of structure specifies
its own iteration within the enclosing context.
Interaction Overview Diagrams
Interaction Overview Diagrams define Interactions (described in Chapter 14, Interactions) through a variant of Activity
Diagrams (described in Chapter 6, Activities) in a way that promotes overview of the control flow.
Interaction Overview Diagrams focus on the overview of the flow of control where the nodes are Interactions or InteractionUse s.
The Lifeline s and the Messages do not appear at this overview level.
Interaction Overview Diagrams are specialization of Activity Diagrams that represent Interactions.
Interaction Overview Diagrams differ from Activity Diagrams in some respects.
Issue 8030 - Remove reference to ActivityInvocations.
1. In place of ObjectNodes of Activity Diagrams, Interaction Overview Diagrams can only have either (inline) Interactions or
InteractionUse s. Inline Interaction diagrams and InteractionUse s are considered special forms of CallBehaviorAction.
2. Alternative Combined Fragments are represented by a Decision Node and a corresponding Merge Node.
5. Branching and joining of branches must in Interaction Overview Diagrams be properly nested. This is more restrictive than
in Activity Diagrams.
6. Interaction Overview Diagrams are framed by the same kind of frame that encloses other forms of Interaction Diagrams. The
heading text may also include a list of the contained Lifeline s (that do not appear graphically).
.
Table 14.5 - Graphic nodes included in Interaction Overview Diagrams in addition to those borrowed from Activity Diagrams
Node Type |
Notation |
Reference |
|
|
|
|
|
|
|
|
|
| Frame |
sd EventOccurrence |
The notation shows a rectangular frame around the diagram with a name in a compartment in the upper left corner. See Interaction
(from BasicInteraction, Fragments ) on page 501.
|
|
|
|
| Interaction |
sd User AC System CardOut |
An Interaction diagram of any kind may appear inline as an ActivityInvocation. See Interaction (from BasicInteraction, Fragments )
on page 501. The inline Interaction diagrams may be either anonymous (as here) or named.
|
|
|
|
| InteractionUse |
Nref |
ActivityInvocation in the form of InteractionUse . See InteractionUse (from Fragments ) on page 508. The tools may choose to
explode the view of an InteractionUse into an inline Interaction with the name of the Interaction referred by the occurrence.
The inline Interaction will then replace the occurrence by a replica of the definition Interaction where arguments have replaced
parameters.
|
|
|
|
*Examples
InteractionUse
Duration Constraint
(inline) Interaction
decision interaction constraint
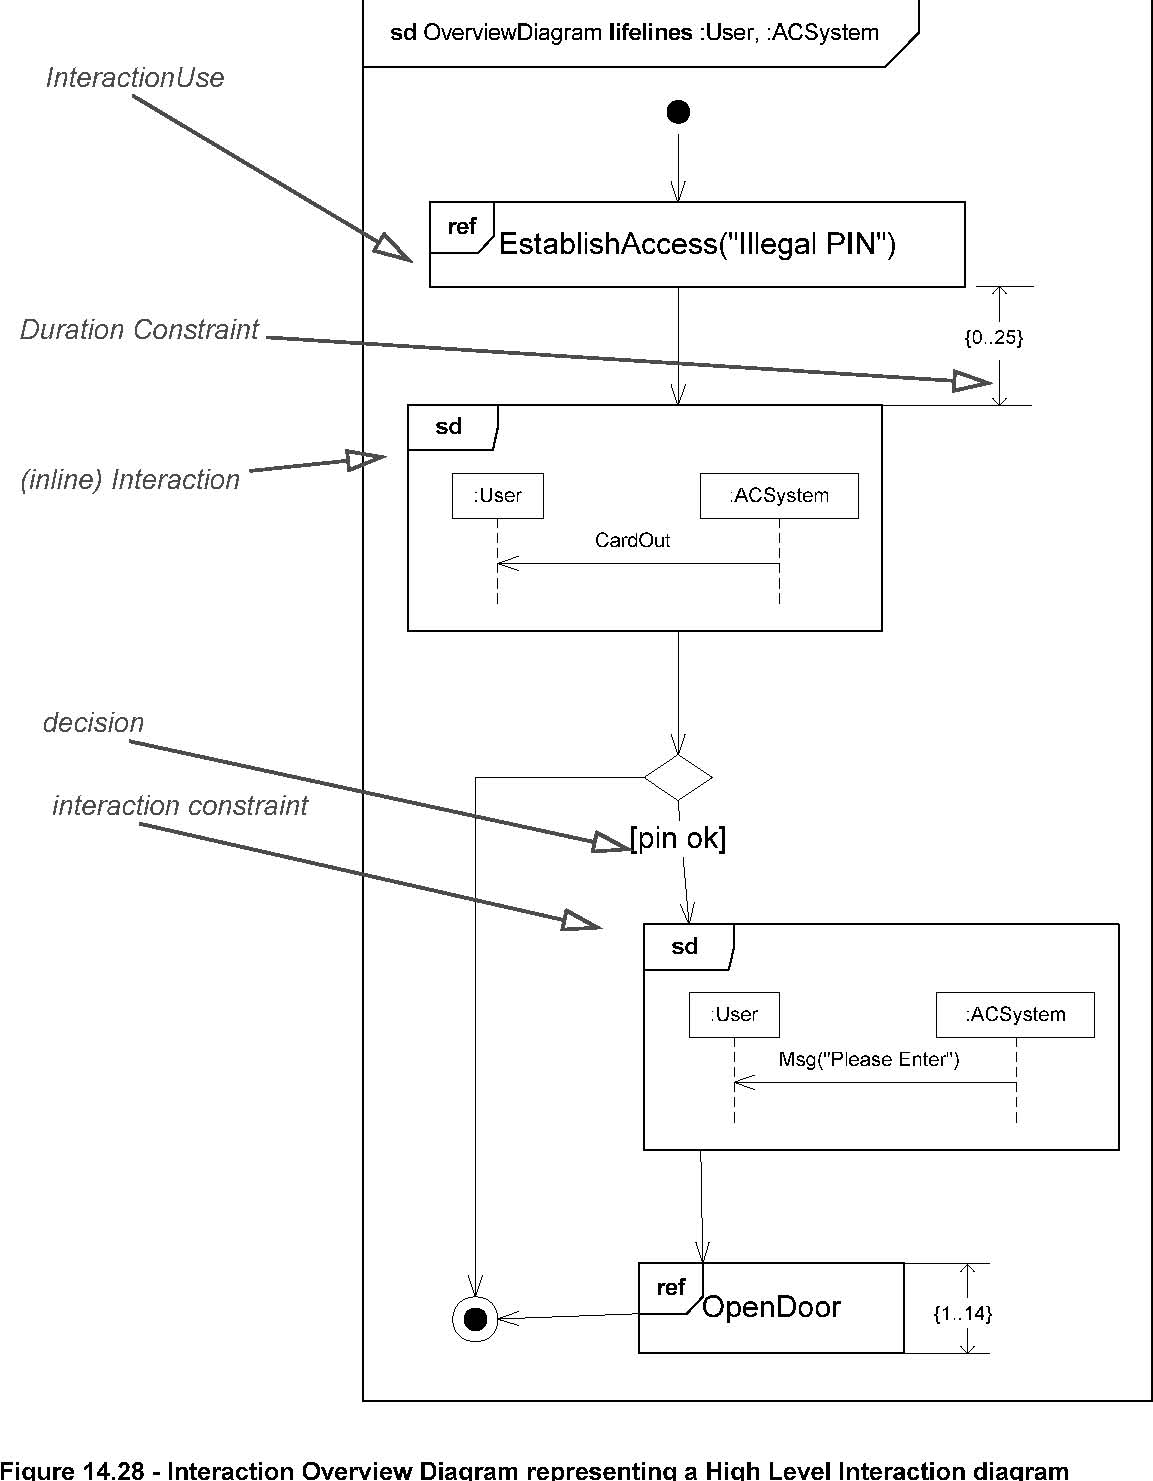 Figure 14.28 - Interaction Overview Diagram representing a High Level Interaction diagram
Interaction Overview Diagrams use Activity diagram notation where the nodes are either Interactions or InteractionUse s. Interaction
Overview Diagrams are a way to describe Interactions where Messages and Lifeline s are abstracted away. In the purest form
all Activities are InteractionUse s and then there are no Messages or Lifeline s shown in the diagram at all.
Figure 14.28 is another way to describe the behavior shown in Figure 14.17, with some added timing
constraints. The Interaction EstablishAccess occurs first (with argument Illegal PIN) followed by weak sequencing with the
message CardOut which is shown in an inline Interaction. Then there is an alternative as we find a decision node with an InteractionConstraint
on one of the branches. Along that control flow we find another inline Interaction and an InteractionUse in (weak) sequence.
Timing Diagram
Timing Diagrams are used to show interactions when a primary purpose of the diagram is to reason about time. Timing diagrams
focus on conditions changing within and among Lifeline s along a linear time axis.
Timing diagrams describe behavior of both individual classifiers and interactions of classifiers, focusing attention on time
of occurrence of events causing changes in the modeled conditions of the Lifeline s.
The graphic nodes and paths that can be included in timing diagrams are shown in
Table 14.6
.
Table 14.6 - Graphic nodes and paths included in timing diagrams
Node Type |
Notation |
|
|
Reference |
|
|
|
|
|
|
|
| Frame |
sd EventOccurrence |
|
|
The notation shows a rectangular frame around the diagram with a name in a compartment in the upper left corner. See Interaction
(from BasicInteraction, Fragments ) on page 501.
|
|
| Message |
VSense d o I t( w : i n t) |
e v A cq u i r e( |
v o i d) : l o ng |
Messages come in different variants depending on what kind of Message they convey. Here we show an asynchronous message, a
call and a reply. See Message (from BasicInteractions ) on page 512.
|
|
Table 14.6 - Graphic nodes and paths included in timing diagrams
Node Type |
Notation |
Reference |
|
|
|
|
|
|
|
|
|
| Message label |
mymsglab mymsglab |
Labels are only notational shorthands used to prevent cluttering of the diagrams with a number of messages crisscrossing the
diagram between Lifeline s that are far apart. The labels denote that a Message may be disrupted by introducing labels with
the same name. |
|
|
|
| State or condition timeline |
Initializing Acquiring Reporting Idle |
This is the state of the classifier or attribute, or some testable condition, such as an discrete enumerable value. See also
StateInvariant (from BasicInteractions ) on page 524. It is also permissible to let the state-dimension be continuous as well
as discrete. This is illustrative for scenarios where certain entities undergo continuous state changes, such as temperature
or density.
|
|
|
|
| General value lifeline |
x"00FF" x"FFFF" |
Shows the value of the connectable element as a function of time. Value is explicitly denoted as text. Crossing reflects the
event where the value changed. |
|
|
|
| Lifeline |
instance 1 Instance 2 |
See Lifeline (from BasicInteractions , Fragments ) on page 511.
|
|
|
|
| GeneralOrdering |

|
See GeneralOrdering (from BasicInteractions ) on page 501.
|
|
|
|
| DestructionEvent |

|
See DestructionEvent (from BasicInteractions ) on page 496.
|
|
|
|
*Examples
Timing diagrams show change in state or other condition of a structural element over time. There are a few forms in use. We
shall give examples of the simplest forms.
Sequence Diagrams as the primary form of Interactions may also depict time observation and timing constraints. We show in
Figure 14.26 an
example in Sequence Diagram that we will also give in Timing Diagrams.
The :User of the Sequence Diagram
in Figure 14.26 is depicted with
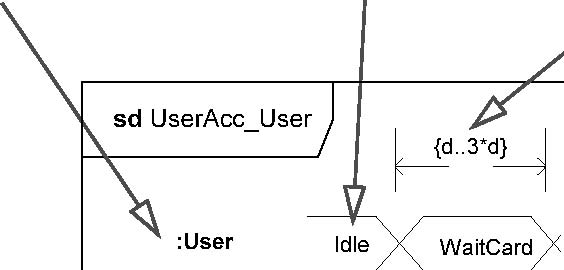
a simple Timing Diagram in Figure 14.29.
Lifeline State or condition DurationConstraint time constraint
012 t
tick mark values timing ruler
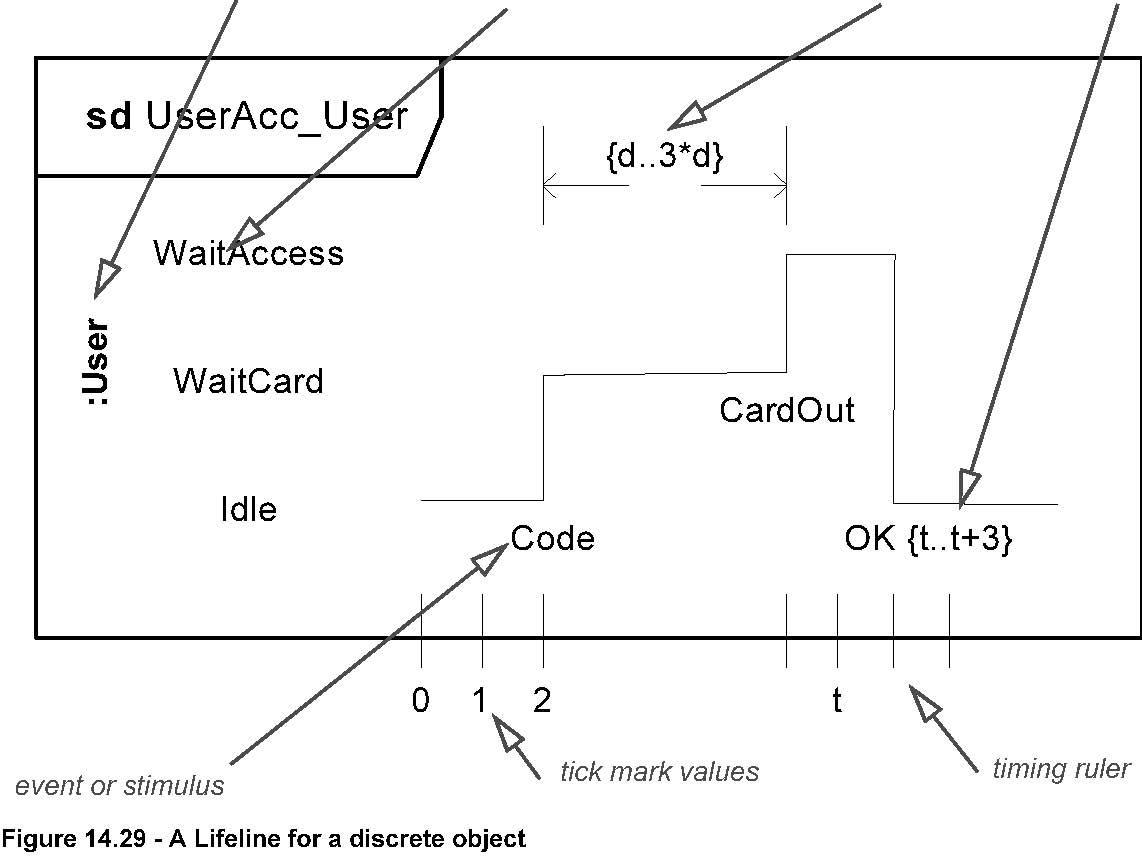 Figure 14.29 - A Lifeline for a discrete object
The primary purpose of the timing diagram is to show the change in state or condition of a lifeline (representing a Classifier
Instance or Classifier Role) over linear time. The most common usage is to show the change in state of an object over time
in response to accepted events or stimuli. The received events are annotated as shown when it is desirable to show the event
causing the change in condition or state.
Sometimes it is more economical and compact to show the state or condition on
the vertical Lifeline as shown in Figure
14.30
.
Lifeline State or condition DurationConstraint
:User Idle
WaitAccess
WaitCard
Idle
{d..3*d}
Figure 14.30 - Compact Lifeline with States
Finally we may have an elaborate form of TimingDiagrams where more than one Lifeline is shown and where the messages are also
depicted. We show
such a Timing Diagram in Figure 14.31 corresponding to the Sequence Diagram in
Figure 14.26.
Lifeline s State or condition Duration Constraints
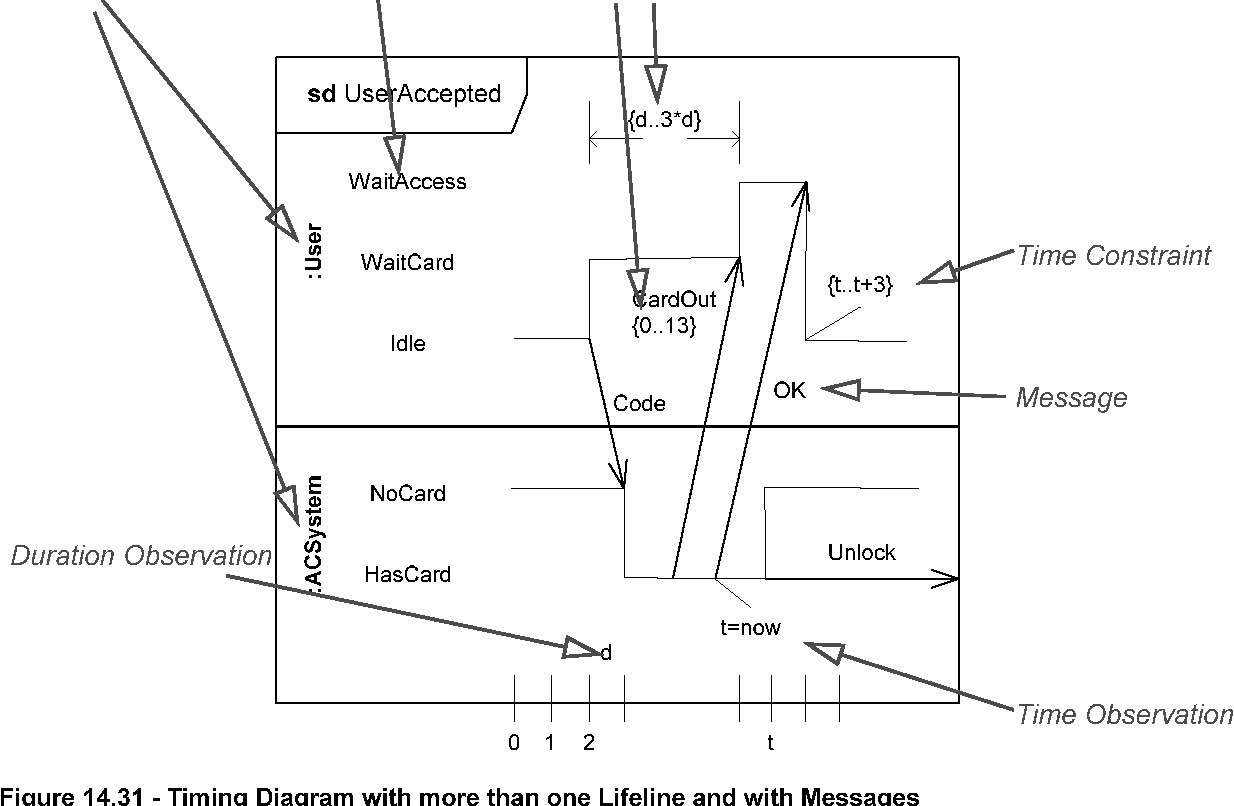 Figure 14.31 - Timing Diagram with more than one Lifeline and with Messages
012 t
*Changes from previous UML
The Timing Diagrams were not available in UML 1.4.


