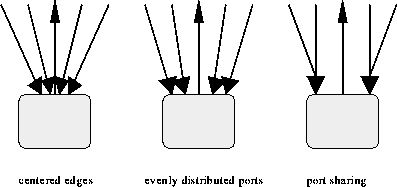
Figure 18: Edge Port Distribution
Start and end points of edges must be adjacent to the border of the corresponding nodes. These points at the border are called edge ports. There are several strategies to calculate edge ports:

Figure 18: Edge Port Distribution
In the proper hierarchy, long edges are split into small edge segments and dummy nodes. This ensures that edges rarely cross nodes, because the dummy nodes don't overlap other nodes. Two situations may occur:
Due to the node positioning algorithm, the edge segments at a dummy node have (nearly) the same gradient. In this case, the dummy node can be removed and the edge can be replaced by a long segment that across several levels.

Figure 20: Spline Layout of PERT Chart
On the other hand, it may happen that a short edge segment still crosses
a node.
Then additional bend points are needed.
This is the case if edges start at small nodes which are close
to large nodes (Fig 19, left).
It is obvious that for an edge (v,w) between adjacent layers,
at most two additional bend points are needed (Fig 19, middle).
As a variant, we can calculate for each angular edge two additional
bend points such that the edge segments are oriented strictly horizontally
or vertically.
Then we get an orthogonal layout (Fig 19, right).
It is important that horizontal and vertical edges should not
share segments, because otherwise the flow of the edges is not well visible.
[Sa96a] presents a plane sweep method for the calculation
of the additional bend points in time ![]() where k is the number of rows of horizontal edge segments
between layer i and layer i+1.
where k is the number of rows of horizontal edge segments
between layer i and layer i+1.
The final result is a routing of edges such that edges never cross nodes. The drawing of an edge is a polygon. [Sa94] and [GKN93] present methods to convert this polygon into a sequence of splines with smooth transitions instead of bend points. Fig. 20 shows a PERT chart with spline edges.

Figure 22: Annotated Syntax Tree