Chapter 8 Processing of Color Signals
MATLAB code for figures and examples
- Fig. 8.1 Display a color image and its RGB components as color images and as gray-scale images.
- MATLAB script: mdsp_web_colsp_color_image_and_components.m
- Output preview: fig8.1a.jpg; fig8.1b.jpg;fig8.1c.jpg;fig8.1d.jpg; fig8.1e.jpg; fig8.1f.jpg;fig8.1g.jpg
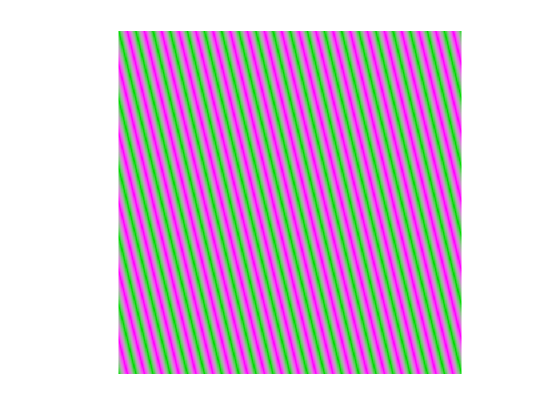
- Fig. 8.2 Example of a real color sinusoidal signal.
- MATLAB script: mdsp_web_colsp_color_sinusoid.m
- Output preview: fig8.2.png
- Fig. 8.3 Perspective view of the frequency response of the three continuous-domain filters of Zhang and Wandell.
- MATLAB script: mdsp_web_colsp_sCIELAB_cont_dom.m
- Output preview:fig8.3a.png; fig8.3b.png;fig8.3c.png
- Fig. 8.4 Perspective view of the frequency response of the three discrete-domain filters of Zhang and Wandell.
- MATLAB script:mdsp_web_colsp_zhang_wandell_filters_freq_resp.m
- Output preview:fig8.4a.png; fig8.4b.png;fig8.4c.png
- Example 8.1 — Fig 8.5 Motorcycles image with different type of noise added to the NTSC YIQ components.
- MATLAB script: mdsp_web_colsp_noise_compare.m
- (a) Low-pass noise. Output preview: fig8.5a.jpg
- (b) High-pass noise. Output preview: fig8.5b.jpg
- Fig. 8.7 Example of a Bayer sampled color image.
- MATLAB script:mdsp_web_colsp_Bayer_image.m
- Output preview:fig8.7a.jpg; fig8.7b.jpg
- Fig. 8.8 Bayer sampled image of Fig. 8.7 reconstructed by separate lowpass filtering of the three channels. Uses function convert_color_basis and loads LCC_filters.mat.
- MATLAB script:mdsp_web_colsp_bayer_reconstruct_LCC.m
- Output preview: fig8.8.jpg