Chapter 7 Light and Color Representation in Imaging Systems
MATLAB code for figures and examples
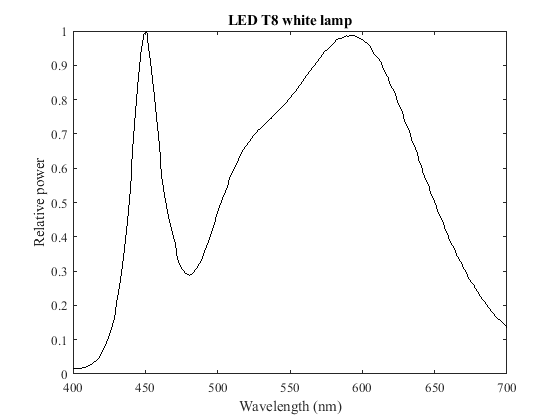
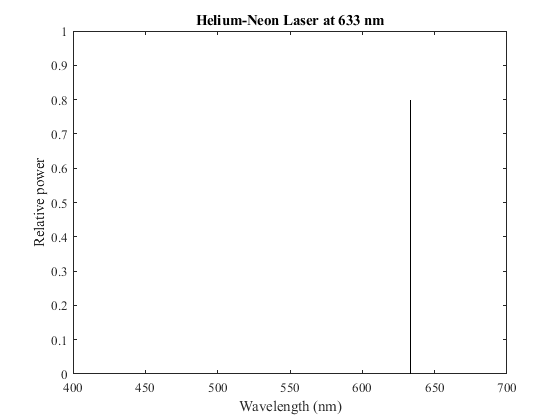
- Fig. 7.1 Power density of various light sources shown in the figure, and a few extras.
- MATLAB script: mdsp_web_col_spectra.m
- Output preview: fig7.1a.png; fig7.1b.png;fig7.1c.png;fig7.1d.png
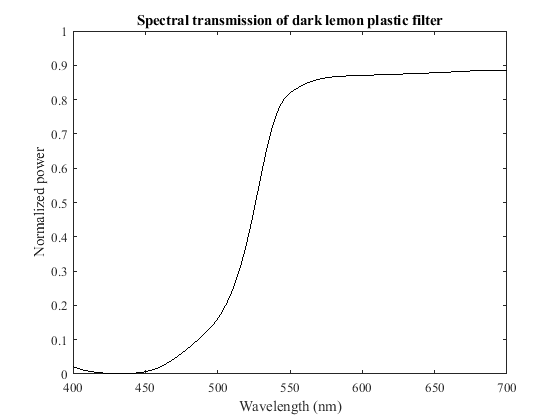
- Fig 7.2 Spectral transmission and relection curves.
- MATLAB script: mdsp_web_col_plot_absorption_reflectance.m
- Output preview: fig7.2a.png; fig7.2b.png
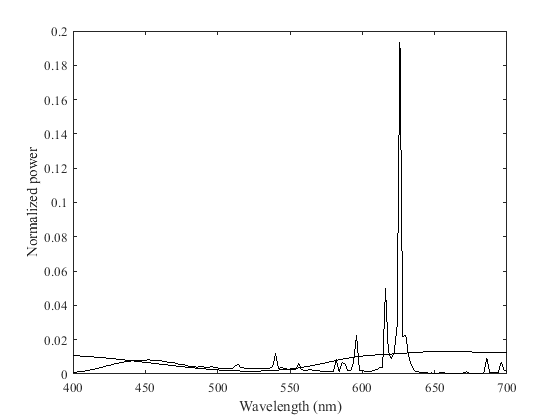
- Fig. 7.3 Spectral densities of two lights that appear as the same medium pink color to a normal trichomatic human viewer.
- MATLAB script: mdsp_web_col_plot_metamers.m
- Output preview: fig7.3.png
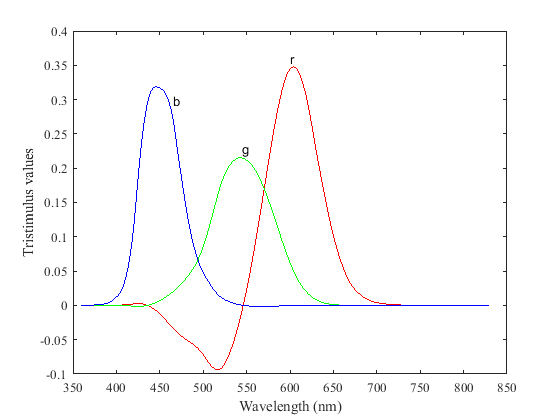
- Fig. 7.4 Color matching functions of the CIE 1931 RGB primaries, monochromatic lights at wavelengths 700.0 nm, 546.1 nm and 435.8 nm respectively
- MATLAB script: mdsp_web_col_plot_ciergbcmf.m
- Output preview: fig7.4.png
- Fig. 7.5 Color matching functions of the CIE 1931 XYZ primaries.
- MATLAB script: mdsp_web_col_plot_xyzcmf.m
- Output preview: fig7.5.png
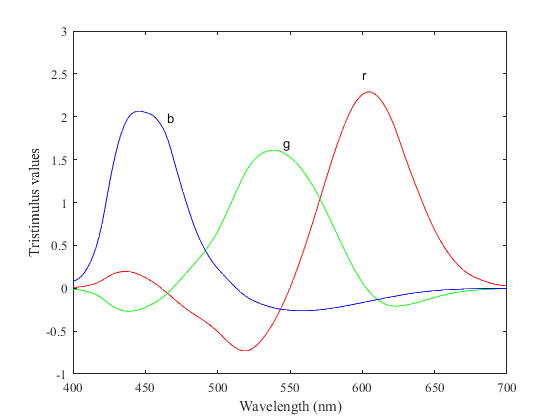
- Fig. 7.6 Color matching functions of the EIZO CRT RGB primaries.
- MATLAB script: mdsp_web_col_plot_Eizo_cmf.m
- Output preview: fig7.6.png
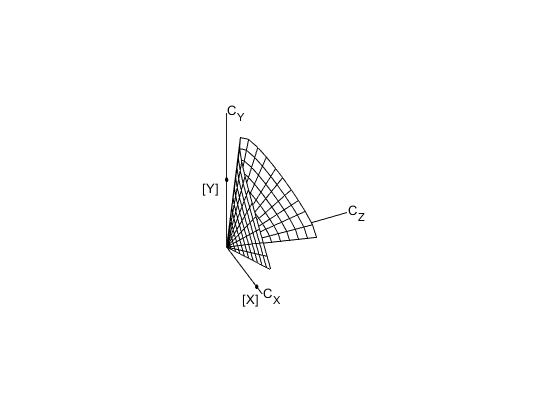
- Fig. 7.7 Cone of physically realizable colors in the CIE 1931 XYZ coordinate system.
- MATLAB script: mdsp_web_col_cone_CR_xyz.m
- Output preview: fig7.7.png
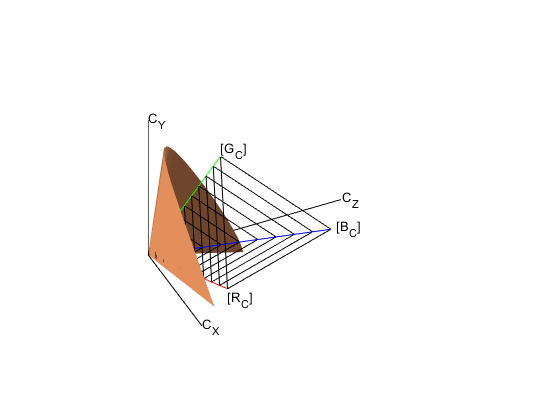
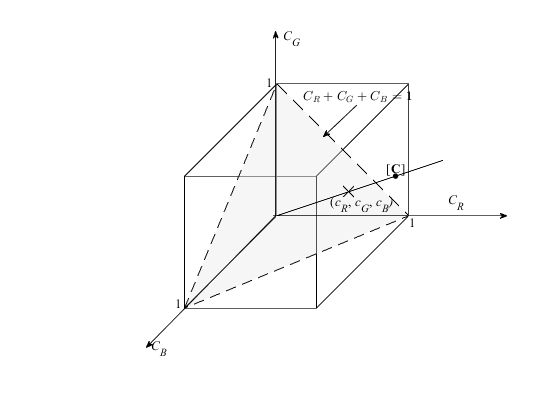
- Fig. 7.8 (a) Illustration of the cone of reproducible colors with red, green and blue display primaries, in the XYZ color coordinate system. (b) The set of reproducible colors with red, green and blue coefficients between 0 and 1,
- MATLAB script: mdsp_web_col_analyze_CIE_1931_primaries.m
- Output preview: fig7.8a.png; fig7.8b.png
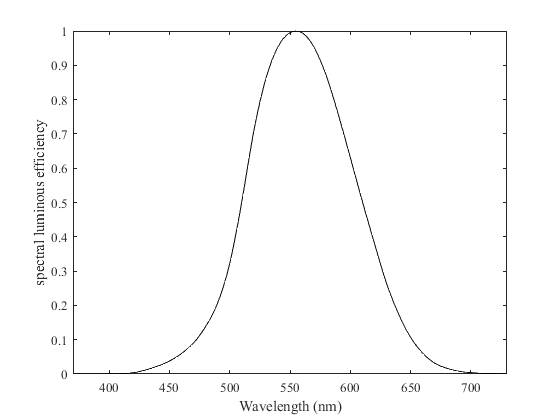
- Fig. 7.9 CIE 1924 relative luminous efficiency.
- MATLAB script: mdsp_web_col_plot_luminous_efficiency.m
- Output preview: fig7.9.png
- Fig. 7.10 Maxwell triangle in RGB coordinates.
- MATLAB script: mdsp_web_col_maxwell_triangle.m
- Output preview: fig7.10.png
- Fig. 7.11 Chromaticity diagram for CIE 1931 XYZ primaries.
- MATLAB script: mdsp_web_col_plot_xyx_chromaticity.m
- Output preview: fig7.11.png
- Fig. 7.12 Chromaticities of colors that can be reproduced by addition of positive quantities of typical RGB display primaries.
- MATLAB script: mdsp_web_col_sRGB_color_triangle_xy_scaled.m
- Output preview: fig7.12.png
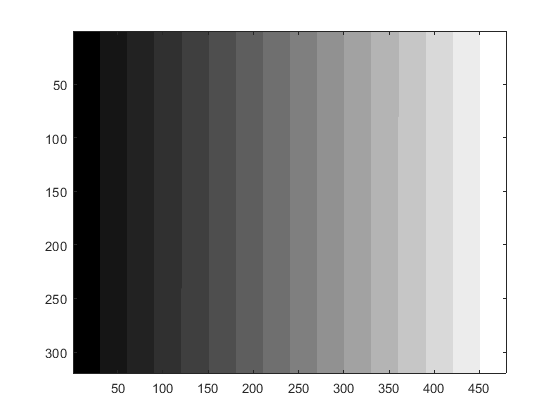
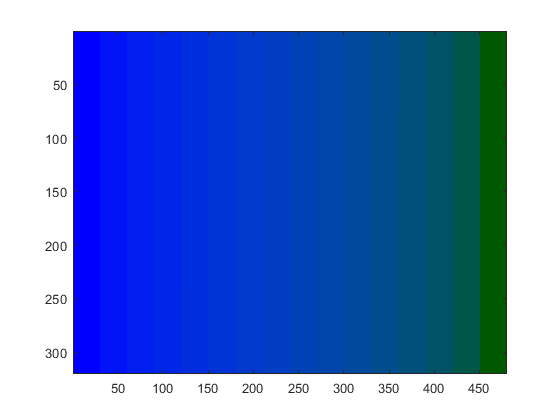
- Fig. 7.13 Step pattern with linearly increasing tristimulus values and linearly increasing CIELAB coordinates.
- MATLAB script: mdsp_web_col_color_step_pattern.m
- Output preview: fig7.13a.png ; fig7.13b.png ; fig7.13c.png ; fig7.13d.png;fig7.13e.png ; fig7.13f.png