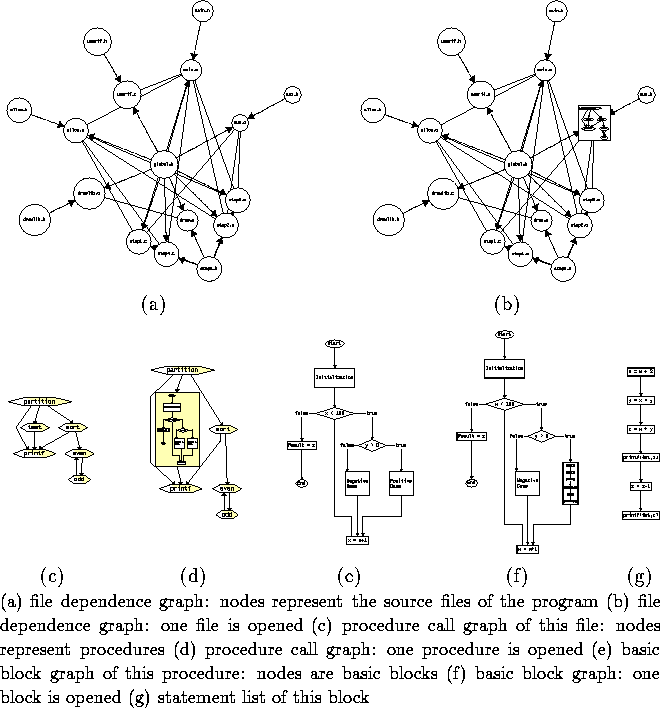
Figure 25: Zooming into a Program Graph

Figure 25: Zooming into a Program Graph
Even if the layout algorithms are rather fast, there is a limit for the usability of flat graphs. If the size of a graph exceeds this limit, the layout algorithm takes a lot of time but the resulting picture of the graph is still unstructured with tangled edges (e.g. Fig. 24). Facilities are needed to stamp structures on the graph, to make them visible, to extract important parts or hide unimportant parts of the structures.
An example shows the main idea: A large program consists of many procedures with many statements. If we would visualize the control flow graph of all these statements at once, then we would see nothing but a black hole. But conceptually, the net of procedures is nested. All procedures are partitioned into the source files of the large program to be visualized. This fact can be exploited for visualization. At the first level, we show just the files as nodes (Fig. 25a). If a procedure of one file is used in another file, we draw an edge between those files. Multiple edges between the same nodes can be summarized to one thick edge, to improve the readability. To inspect the procedures of some file, we zoom into this file (Fig. 25b), i.e. we unfold the corresponding node. Then, we see the call graph of the procedures of this file. The nodes are the procedures and there is an edge from procedure A to B, iff A calls B (Fig. 25c). Next, we unfold one procedure (Fig. 25d) and see the basic block graph that shows the structure of the control flow of this procedure (Fig. 25e). To inspect statements of this graph, we select a basic block (Fig. 25f) and show its statement list exclusively (Fig. 25g). As we unfolded the graph, we can also fold the nodes in the inverse order.

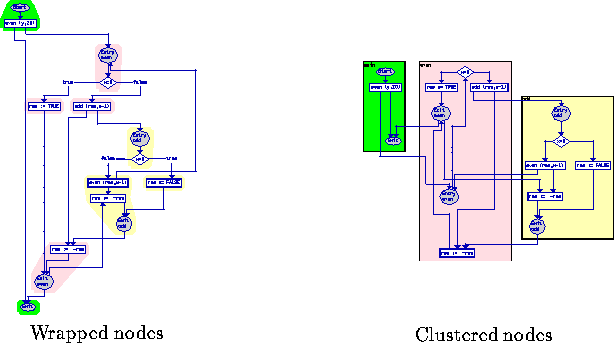
Figure 26: Interprocedural Control Flow Graph of 3 Procedures
It is also useful to see all statements at the same time. But then, it must be clearly which statement belongs to which procedure. We don't want to trust that the layout algorithm will place the nodes of the same procedure close together by accident. A very simple method is to mark nodes by a unique colored wrapper (Fig. 26, left). Nodes that belong to the same procedure have the same color. Another possibility is to cluster the nodes, i.e. to calculate a layout such that the related nodes are so close together that a surrounding frame can be drawn (Fig. 26, right). In this case, the picture of a graph contains nested frames.