Exercise
Consider a capacitor of 10 µF.
What is the voltage across the
capacitor when the current through it
is shown graphically in Figure 12.4?
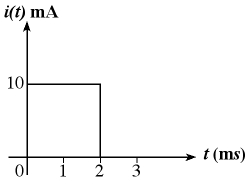
Figure 12.4
The current waveform through a capacitor.
Type your solution in the box below:
Solution: Using Equation
(12.8)
The difference between the values of the
voltage at t
and t0
is proportional to the area under the
current curve between these same two values
of time. The proportionality is 1/C.
Let us start our starting point t0
prior to zero time at
- .
From the current waveform, it is clear
that no current has ever been applied
to the capacitor since the beginning of
time .
From the current waveform, it is clear
that no current has ever been applied
to the capacitor since the beginning of
time
Accordingly, the integral of the current
(first equation) between t0
= -
and 0 is simply zero. Since i
= 0 in that interval, thus,
or
Now consider the time interval represented
by the rectangular pulse
Since v(0)
= 0
Accordingly

Graphical Representation
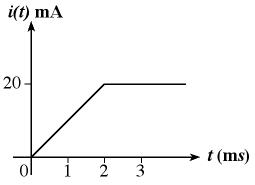
Figure 12.5
Graphical representation
|